Lenovo Group Limited (PINK:LNVGY) ADS’s analysis versus peers uses the following peer-set: Apple Inc. (NASDAQ:AAPL), Hewlett-Packard Company (NYSE:HPQ), Dell Inc. (NASDAQ:DELL), Quanta Computer Inc. (TPE:2382), FUJITSU LIMITED (TYO:6702), Foxconn Technology Co., Ltd. (TPE:2354) and COMPAL ELEC 144A (PINK:CMPCY). The table below shows the preliminary results along with the recent trend for revenues, net income and returns.
| Quarterly (USD million) | 2012-06-30 | 2012-03-31 | 2011-12-31 | 2011-09-30 | 2011-06-30 |
|---|---|---|---|---|---|
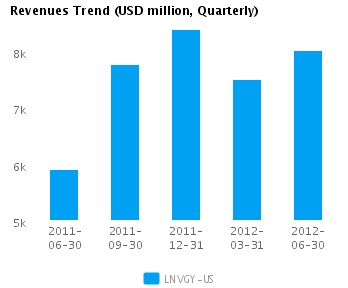
| Revenues | 8,020.3 | 7,510.8 | 8,382.0 | 7,773.5 | 5,916.8 |
| Revenue Growth % | 6.8 | (10.4) | 7.8 | 31.4 | 21.5 |
| Net Income | 141.6 | 66.9 | 153.6 | 143.7 | 108.7 |
| Net Income Growth % | 111.4 | (56.4) | 6.9 | 32.1 | 158.6 |
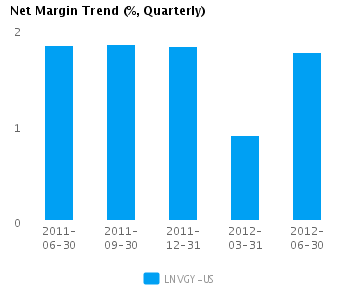
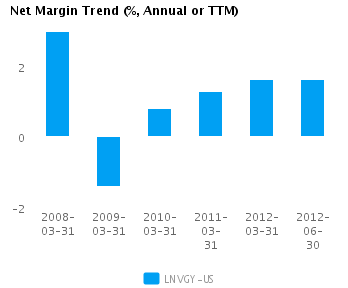
| Net Margin % | 1.8 | 0.9 | 1.8 | 1.8 | 1.8 |
| ROE % (Annualized) | 23.6 | 11.3 | 26.5 | 27.2 | 22.9 |
| ROA % (Annualized) | 3.6 | 1.7 | 3.8 | 4.0 | 3.8 |
Valuation Drivers
Lenovo Group Ltd. ADS currently trades at a higher Price/Book ratio (3.8) than its peer median (2.5). LNVGY-US achieved a better operating performance than the median of its chosen peers (ROE of 23.0% compared to the peer median ROE of 15.8%) and the market still expects faster growth from it than from those peers (PE of 18.6 compared to peer median of 12.4).
The company’s median net profit margins of 1.6% and relative asset efficiency (asset turns of 2.3x compared to peer median of 1.5x) give it some operating leverage. LNVGY-US’s net margin is greater than (but within one standard deviation of) its five-year average net margin of 1.0%.
Economic Moat
The company enjoys both better than peer median annual revenue growth of 37.0% and better than peer median earnings growth performance 73.2%. LNVGY-US currently converts every 1% of change in annual revenue into 2.0% of change in annual reported earnings. We view this company as a leader among its peers.
LNVGY-US’s current return on assets is around the same as its peer median (3.6% vs. peer median 3.6%). This recent performance contrasts with its less than peer median return on assets over the past five years (2.5% vs. peer median 6.7%) suggesting that the company’s relative operating performance is improving.
The company’s comparatively low gross margin of 12.2% versus peer median of 18.6% suggests that it has a non-differentiated strategy or is in a pricing constrained position. In addition, LNVGY-US’s bottom-line operating performance is below peer median (pre-tax margins of 2.0% compared to peer median 2.6%) suggesting relatively high operating costs.
Growth & Investment Strategy
LNVGY-US has grown its revenues faster than its peers (25.7% vs. 6.6% respectively for the past three years). The market also sees relatively higher long-term growth prospects for the company, giving it a better than peer median PE ratio of 18.6. Overall, we classify the company’s growth prospects as superior relative to its peers.
LNVGY-US’s annualized rate of change in capital of 3.1% over the past three years is less than its peer median of 9.4%. This investment has generated a peer median return on capital of 13.2% averaged over the same three years. The median return on capital investment on a relatively lower investment suggests that the company is under investing.
Earnings Quality
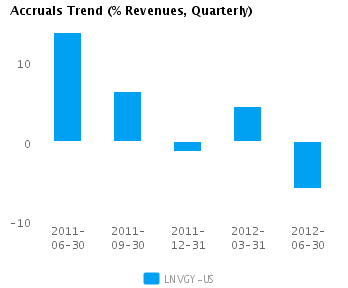
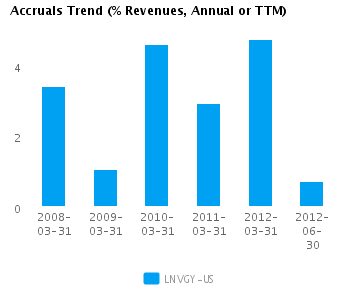
LNVGY-US’s reported net income margin for the last twelve months is around the peer median (1.6% vs. peer median of 1.9%). However, the company has also recorded a relatively low level of accruals (0.7% vs. peer median of 3.7%) which suggests possible overstatement of its reported net income.
LNVGY-US’s accruals over the last twelve months are around zero. However, this modestly positive level is also less than the peer median which suggests some amount of building of reserves.
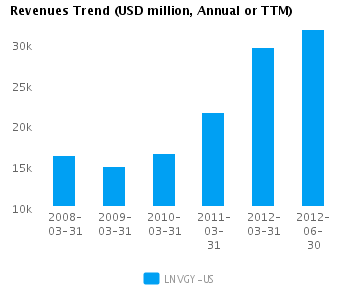
Trend Charts
Company Profile
Disclaimer
This article was originally written by abha.dawesar, and posted on CapitalCube.


