Global Payments Inc (NYSE:GPN) recently reported its preliminary financial results based on which we provide a unique peer-based analysis of the company. Our analysis is based on the company’s performance over the last twelve months (unless stated otherwise). For a more detailed analysis of this company (and over 40,000 other global equities) please visitwww.capitalcube.com.
Global Payments Inc.’s analysis versus peers uses the following peer-set: The Western Union Company (NYSE:WU), Fiserv, Inc. (NASDAQ:FISV), Fidelity National Information Services (NYSE:FIS), Total System Services, Inc. (NYSE:TSS), Heartland Payment Systems, Inc. (NYSE:HPY), Moneygram International Inc (NYSE:MGI) and Euronet Worldwide, Inc. (NASDAQ:EEFT). The table below shows the preliminary results along with the recent trend for revenues, net income and returns.

Valuation Drivers
Global Payments Inc.’s current Price/Book of 2.9 is about median in its peer group. The market expects GPN-US to grow at about the same rate as its chosen peers (PE of 19.3 compared to peer median of 19.0) and to maintain the peer median return (ROE of 14.8%) it currently generates.
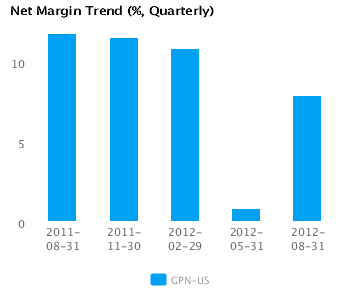
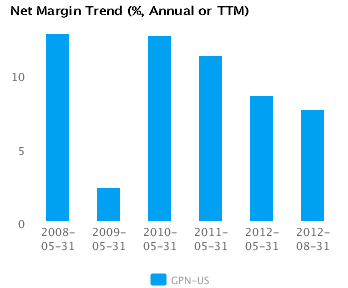
The company’s asset efficiency (asset turns of 0.8x) and net profit margins of 7.6% are both median for its peer group. GPN-US’s net margin continues to trend downward and is below (but within one standard deviation of) its four-year average net margin of 9.5%.
Economic Moat
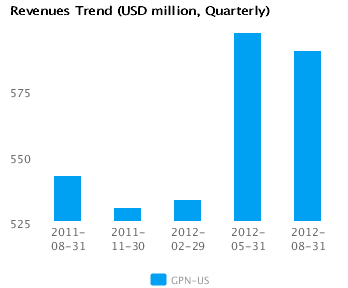
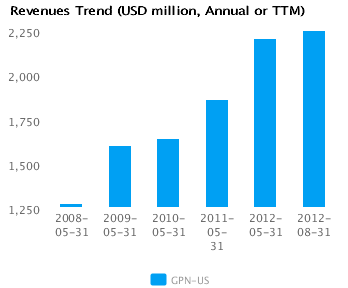
The company has achieved better revenues growth than its chosen peers (year-on-year change in revenues of 18.5%) but its earnings growth performance has been below the median (change in annual reported earnings of -10.5% compared to the peer median of 19.6%). This suggests that, compared to its peers, the company is focused more on top-line revenues. GPN-US is currently converting every 1% of change in revenue into -0.6% change in annual reported earnings.
GPN-US’s current return on assets is around peer median (6.2% vs. peer median 6.5%). This contrasts with its higher than peer median return on assets over the past five years (8.0% vs. peer median 5.0%), suggesting that the company’s relative operating performance has declined.
The company’s comparatively high gross margin of 69.2% versus peer median of 42.6% suggests that it has a differentiated strategy with pricing advantages. However, GPN-US’s pre-tax margin of 12.1% is around the peer median which, combined with the healthy gross margin, suggests higher operating costs relative to peers.
Growth & Investment Strategy
While GPN-US’s revenues have grown faster than the peer median (11.2% vs. 6.2% respectively for the past three years), the market gives the stock an about peer median PE ratio of 19.3. This suggests that the market has some questions about the company’s long-term strategy.
GPN-US’s annualized rate of change in capital of 10.7% over the past three years is higher than its peer median of 6.6%. This investment has generated an above peer median return on capital of 13.3% averaged over the same three years. Evidently, the relatively high capital investment was successful given the the relatively strong growth in its returns.
Earnings Quality
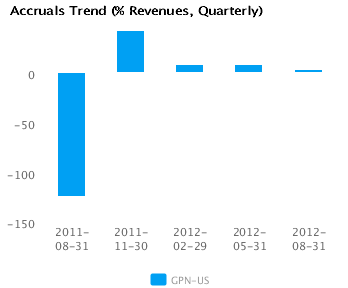
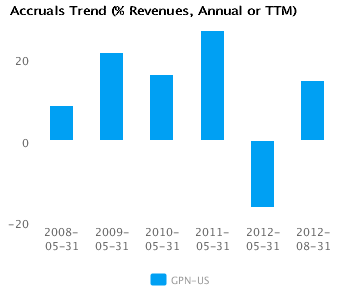
GPN-US’s net income margin for the last twelve months is around the peer median (7.6% vs. peer median of 8.3%). This average margin and relatively conservative accrual policy (14.7% vs. peer median of 7.1%) suggests possible understatement of its reported net income.
GPN-US’s accruals over the last twelve months are positive suggesting a buildup of reserves. In addition, the level of accrual is greater than the peer median — which suggests a relatively strong buildup in reserves compared to its peers.
Trend Charts