Jabil Circuit, Inc. (NYSE:JBL) recently reported its preliminary financial results based on which we provide a unique peer-based analysis of the company. Our analysis is based on the company’s performance over the last twelve months (unless stated otherwise). For a more detailed analysis of this company (and over 40,000 other global equities) please visitwww.capitalcube.com.
Jabil Circuit Inc.’s analysis versus peers uses the following peer-set: Flextronics International Ltd. (NASDAQ:FLEX), Pegatron Corporation (TPE:4938), Foxconn International Holdings Limited (HKG:2038), Unimicron Technology Corp. (TPE:3037), Hittite Microwave Corp (NASDAQ:HITT), Celestica Inc. (NYSE:CLS), Tripod Technology Corporation (TPE:3044), Plexus Corp. (NASDAQ:PLXS), Benchmark Electronics, Inc. (NYSE:BHE) and Sanmina-SCI Corporation (NASDAQ:SANM). The table below shows the preliminary results along with the recent trend for revenues, net income and returns.

Valuation Drivers
Jabil Circuit Inc.’s current Price/Book of 2.1 is about median in its peer group. JBL-US’s operating performance is higher than the median of its chosen peers (ROE of 19.9% compared to the peer median ROE of 13.1%) but the market does not seem to expect higher growth relative to peers (PE of 11.4 compared to peer median of 14.3) but simply to maintain its relatively high rates of return.
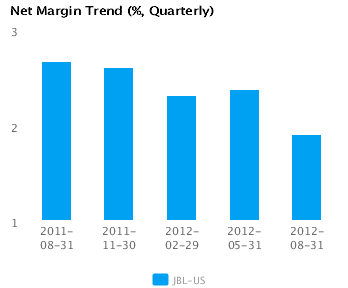
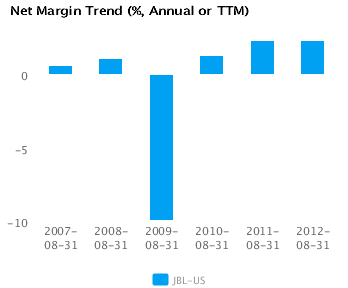
The company’s median net profit margins of 2.3% and relative asset efficiency (asset turns of 2.3x compared to peer median of 1.7x) give it some operating leverage. JBL-US’s net margin is similar to last year’s high of 2.3%, which compares to a low of -10.0% in 2009.
Economic Moat
Changes in the company’s revenues are in-line with its peers (annual revenue changed by 3.8%) but its earnings performance has been better — its annual earnings changed by 3.6% compared to the peer median of -14.4%, implying that it has better cost control relative to its peers. JBL-US currently converts every 1% of change in revenue into 0.9% of change in annual reported earnings.
JBL-US’s current return on assets is around the same as its peer median (5.3% vs. peer median 4.5%). This recent performance contrasts with its less than peer median return on assets over the past five years (-0.6% vs. peer median 2.3%) suggesting that the company’s relative operating performance is improving.
The company’s gross margin of 9.6% is around peer median suggesting that JBL-US’s operations do not benefit from any differentiating pricing advantage. In addition, JBL-US’s pre-tax margin of 3.0% is also around the peer median suggesting no operating cost advantage relative to peers.
Growth & Investment Strategy
While JBL-US’s revenues have grown faster than the peer median (13.6% vs. 5.3% respectively for the past three years), the market gives the stock an about peer median PE ratio of 11.4. This suggests that the market has some questions about the company’s long-term strategy.
JBL-US’s annualized rate of change in capital of 12.3% over the past three years is higher than its peer median of 3.8%. This investment has generated an above peer median return on capital of 10.3% averaged over the same three years. Evidently, the relatively high capital investment was successful given the the relatively strong growth in its returns.
Earnings Quality
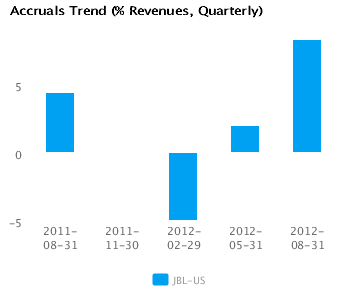
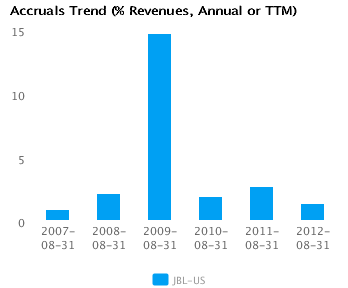
JBL-US’s reported net income margin for the last twelve months is around the peer median (2.3% vs. peer median of 2.3%). However, the company has also recorded a relatively low level of accruals (1.4% vs. peer median of 2.2%) which suggests possible overstatement of its reported net income.
JBL-US’s accruals over the last twelve months are around zero. However, this modestly positive level is also less than the peer median which suggests some amount of building of reserves.
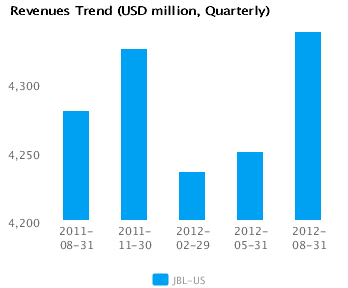
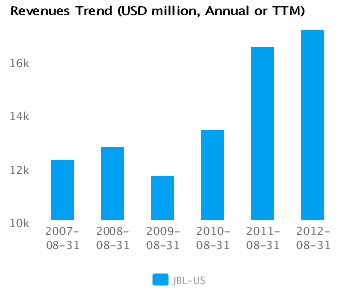
Trend Charts