FactSet Research Systems Inc. (NYSE:FDS) recently reported its preliminary financial results based on which we provide a unique peer-based analysis of the company. Our analysis is based on the company’s performance over the last twelve months (unless stated otherwise). For a more detailed analysis of this company (and over 40,000 other global equities) please visit www.capitalcube.com.
FactSet Research Systems Inc.’s analysis versus peers uses the following peer-set: News Corp (NASDAQ:NWS), Thomson Reuters Corporation (NYSE:TRI), The McGraw-Hill Companies, Inc. (NYSE:MHP), IHS Inc. (NYSE:IHS), Msci Inc (NYSE:MSCI) and Morningstar, Inc. (NASDAQ:MORN). The table below shows the preliminary results along with the recent trend for revenues, net income and returns.

Valuation Drivers
FactSet Research Systems Inc. currently trades at a higher Price/Book ratio (8.3) than its peer median (6.1). FDS-US’s operating performance is higher than the median of its chosen peers (ROE of 35.4% compared to the peer median ROE of 11.8%) but the market does not seem to expect higher growth relative to peers (PE of 24.9 compared to peer median of 28.8) but simply to maintain its relatively high rates of return.
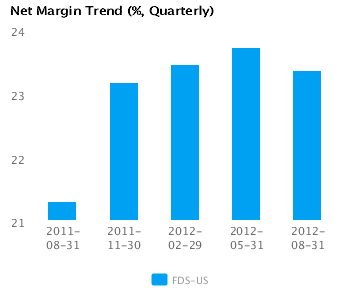
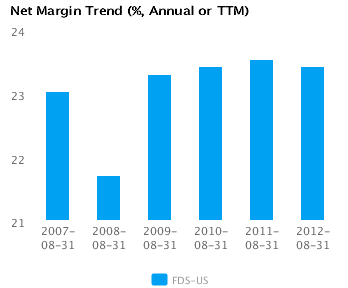
The company has a successful operating strategy with above median net profit margins of 23.4% (vs. peer median of 13.3%) and relatively high asset turns of 1.2x (vs. peer median of 0.6x). This suggests that the company has a dominant operating model relative to its peers. FDS-US’s net margin is similar to last year’s high of 23.5%, which compares to a low of 21.7% in 2008.
Economic Moat
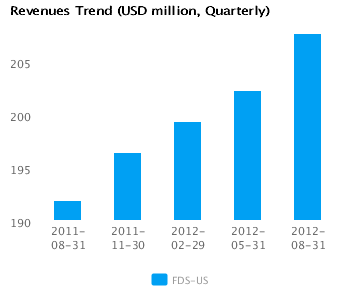
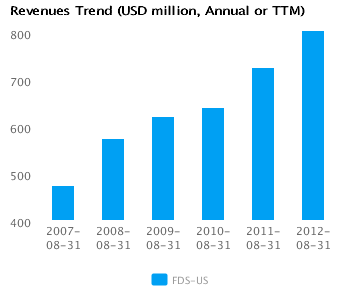
The company enjoys both better than peer median annual revenue growth of 10.9% and better than peer median earnings growth performance 10.4%. FDS-US currently converts every 1% of change in annual revenue into 1.0% of change in annual reported earnings. We view this company as a leader among its peers.
FDS-US’s return on assets is above its peer median both in the current period (27.9% vs. peer median 5.8%) and also over the past five years (24.6% vs. peer median 7.2%). This performance suggests that the company’s relatively high operating returns are sustainable.
The company’s gross margin of 70.0% is around peer median suggesting that FDS-US’s operations do not benefit from any differentiating pricing advantage. However, FDS-US’s pre-tax margin is more than the peer median (34.1% compared to 21.5%) suggesting relatively tight control on operating costs.
Growth & Investment Strategy
FDS-US’s revenues have grown at about the same rate as its peers (9.0% vs. 7.9% respectively for the past three years). Similarly, the stock price implies median long-term growth as its PE ratio is around the peer median of 24.9. The historical performance and long-term growth expectations for the company are largely in sync.
FDS-US’s annualized rate of change in capital of 3.3% over the past three years is around the same as its peer median of 3.3%. This investment has generated a better than peer median return on capital of 33.0% averaged over the same three years. The greater than peer median rate of return suggest that the company may be under investing in growth.
Earnings Quality
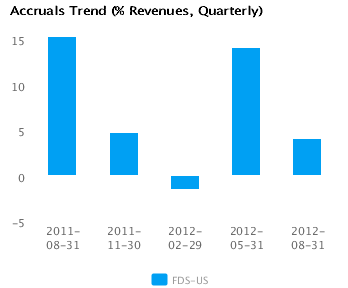
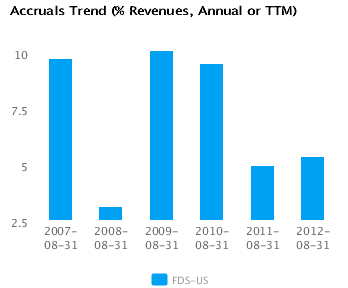
FDS-US has reported relatively strong net income margin for the last twelve months (23.4% vs. peer median of 13.3%). This margin performance combined with relatively low accruals (5.4% vs. peer median of 9.5%) suggests possible aggressive accounting and an overstatement of its reported net income.
FDS-US’s accruals over the last twelve months are positive suggesting a buildup of reserves. But this level of accruals is less than the peer median — which suggests that while the company is building reserves, it is doing so in a relatively modest manner compared to its peers.
Trend Charts