CVS Caremark Corporation (NYSE:CVS) recently reported its preliminary financial results based on which we provide a unique peer-based analysis of the company. Our analysis is based on the company’s performance over the last twelve months (unless stated otherwise). For a more detailed analysis of this company (and over 40,000 other global equities) please visit www.capitalcube.com.
CVS Caremark Corp.’s analysis versus peers uses the following peer-set: Walgreen Company (NYSE:WAG), Shoppers Drug Mart Corporation (TSE:SC), SUNDRUG CO., LTD. (TYO:9989), Rite Aid Corporation (NYSE:RAD), BioScrip Inc. (NASDAQ:BIOS), PharMerica Corporation (NYSE:PMC) and Petmed Express Inc (NASDAQ:PETS). The table below shows the preliminary results along with the recent trend for revenues, net income and returns.
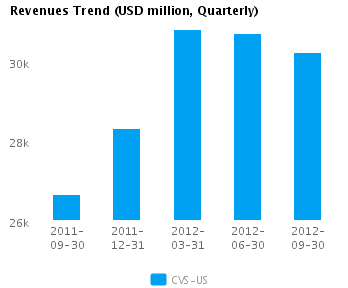
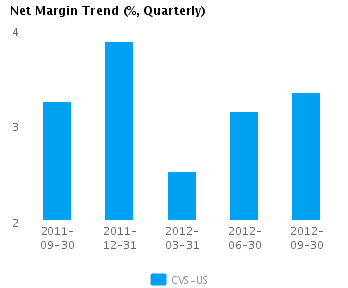
| Quarterly (USD million) | 2012-09-30 | 2012-06-30 | 2012-03-31 | 2011-12-31 | 2011-09-30 |
|---|---|---|---|---|---|
| Revenues | 30,227.0 | 30,714.0 | 30,798.0 | 28,317.0 | 26,674.0 |
| Revenue Growth % | (1.6) | (0.3) | 8.8 | 6.2 | 0.2 |
| Net Income | 1,011.0 | 967.0 | 777.0 | 1,100.0 | 868.0 |
| Net Income Growth % | 4.6 | 24.5 | (29.4) | 26.7 | 6.2 |
| Net Margin % | 3.3 | 3.1 | 2.5 | 3.9 | 3.3 |
| ROE % (Annualized) | 10.8 | 10.2 | 8.2 | 11.6 | 9.2 |
| ROA % (Annualized) | 6.2 | 5.9 | 4.8 | 6.8 | 5.3 |
Valuation Drivers
CVS Caremark Corp.’s current Price/Book of 1.6 is about median in its peer group. The market expects CVS-US to grow at about the same rate as its chosen peers (PE of 15.4 compared to peer median of 14.5) and to maintain the peer median return (ROE of 10.4%) it currently generates.
The company employs relatively high amounts of assets (with a turnover of 1.8x compared to peer median of 2.4x) while generating profit margins of 3.2% that are only about median among its chosen peers. CVS-US’s net margin is its lowest relative to the last five years and compares to a high of 3.8% in 2008.
Economic Moat
The company has achieved better revenues growth than its chosen peers (year-on-year change in revenues of 11.1%) but its earnings growth performance has been below the median (change in annual reported earnings of 1.5% compared to the peer median of 18.8%). This suggests that, compared to its peers, the company is focused more on top-line revenues. CVS-US is currently converting every 1% of change in revenue into 0.1% change in annual reported earnings.
CVS-US’s return on assets currently is around peer median (5.9% vs. peer median 6.5%) — similar to its returns over the past five years (6.0% vs. peer median 7.4%). This performance suggests that the company has no specific competitive advantages relative to its peers.
The company’s comparatively low gross margins of 19.2% versus peer median of 26.4% suggests that it has a non-differentiated strategy or is in a pricing constrained position. However, CVS-US’s pre-tax margin of 5.3% is around the peer median which, when combined with the gross margin, suggests lower operating costs relative to peers.
Growth & Investment Strategy
While CVS-US’s revenues have grown faster than the peer median (7.0% vs. 3.9% respectively for the past three years), the market gives the stock an about peer median PE ratio of 15.4. This suggests that the market has some questions about the company’s long-term strategy.
CVS-US’s annualized rate of change in capital of 1.2% over the past three years is less than its peer median of 4.8%. This investment has generated a peer median return on capital of 7.5% averaged over the same three years. The median return on capital investment on a relatively lower investment suggests that the company is under investing.
Earnings Quality
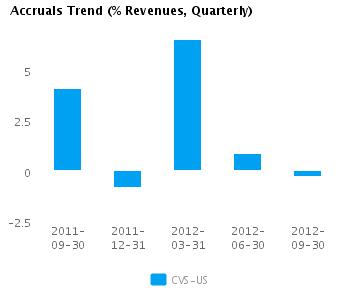
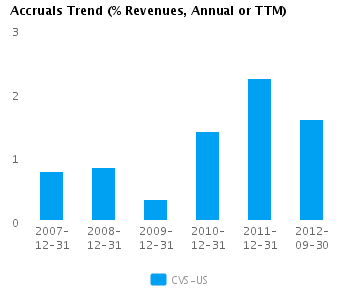
CVS-US’s reported net income margin for the last twelve months is around the peer median (3.2% vs. peer median of 3.1%). However, the company has also recorded a relatively low level of accruals (1.6% vs. peer median of 2.1%) which suggests possible overstatement of its reported net income.
CVS-US’s accruals over the last twelve months are around zero. However, this modestly positive level is also less than the peer median which suggests some amount of building of reserves.
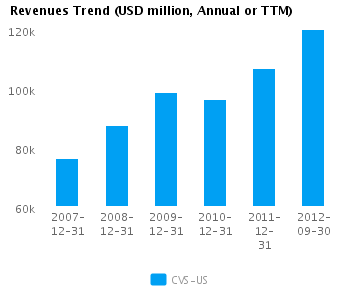
Trend Charts