Constellation Brands, Inc. (NYSE:STZ) recently reported its preliminary financial results based on which we provide a unique peer-based analysis of the company. Our analysis is based on the company’s performance over the last twelve months (unless stated otherwise). For a more detailed analysis of this company (and over 40,000 other global equities) please visit www.capitalcube.com.
Constellation Brands Inc. Cl A’s analysis versus peers uses the following peer-set: Diageo plc (NYSE:DEO), Brown-Forman Corporation (NYSE:BF.B), BEAM Inc (NYSE:BEAM), Lu Zhou Lao Jiao Co.,Ltd (SHE:000568), Molson Coors Brewing Company (NYSE:TAP), Remy Cointreau (EPA:RCO), Shanxi Xinghuacun Fen Wine Factory Co. (SHA:600809), Compania Cervecerias Unidas S.A. (NYSE:CCU), Treasury Wine Estates Ltd. (TWE) and Anhui Golden Seed Winery Co., Ltd. (SHA:600199). The table below shows the preliminary results along with the recent trend for revenues, net income and returns.

Valuation Drivers
Constellation Brands Inc. Cl A’s current Price/Book of 2.5 is about median in its peer group. We classify STZ-US asChallenged because of its below peer median returns (ROE of 15.2% compared to the peer median ROE of 20.9%) and the market’s low expectations of its growth (PE of 18.6 compared to peer median of 26.5).
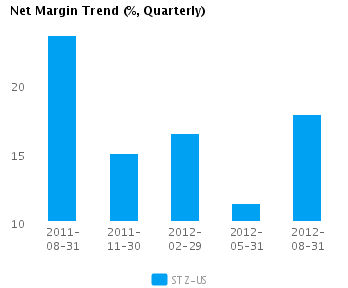
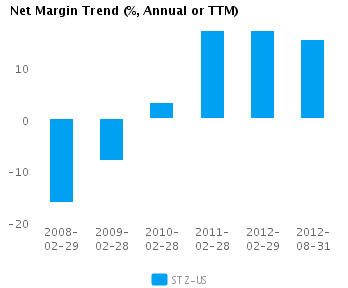
The company employs relatively high amounts of assets (with a turnover of 0.4x compared to peer median of 0.5x) while generating profit margins of 15.2% that are only about median among its chosen peers. STZ-US’s net margin continues to trend downward but is still within one standard deviation above its five-year average net margin of 2.4%.
Economic Moat
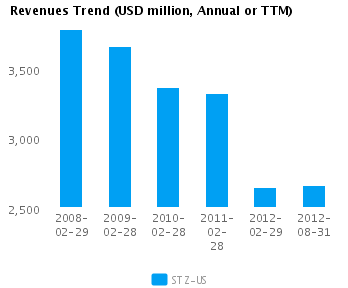
Changes in the company’s annual top line and earnings (-20.2% and -20.5% respectively) generally lag its peers. This implies a lack of strategic focus and/or inability to execute. We view such companies as laggards relative to peers.
STZ-US’s return on assets is less than its peer median currently (5.4% vs. peer median 8.0%). It has also had less than peer median returns on assets over the past five years (1.0% vs. peer median 8.9%). This performance suggests thatthe company has persistent operating challenges relative to peers.
The company’s comparatively low gross margins of 44.3% versus peer median of 57.3% suggests that it has a non-differentiated strategy or is in a pricing constrained position. However, STZ-US’s pre-tax margin of 15.2% is around the peer median which, when combined with the gross margin, suggests lower operating costs relative to peers.
Growth & Investment Strategy
STZ-US’s revenues have grown more slowly than the peer median over the last few years (-10.2% vs. 3.1% respectively for the past three years) and the stock price’s relatively low PE ratio of 18.6 implies relatively low future growth as well. Overall, we view the company’s growth expectations as substandard relative to its peers.
STZ-US’s annualized rate of change in capital of -2.9% over the past three years is less than its peer median of 3.9%. This below median investment level has also generated a less than peer median return on capital of 6.1% averaged over the same three years. This outcome suggests that the company has invested capital relatively poorly and now may be in maintenance mode.
Earnings Quality
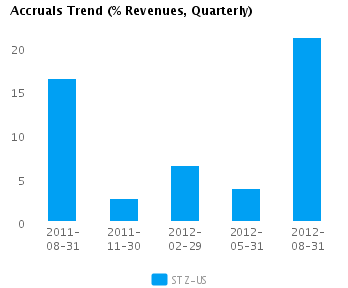
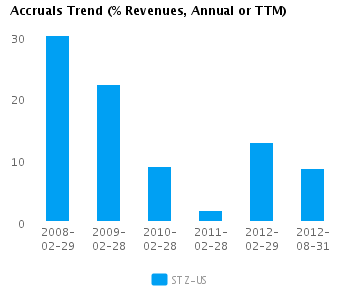
STZ-US’s net income margin for the last twelve months is around the peer median (15.2% vs. peer median of 15.4%). This average margin and relatively conservative accrual policy (8.7% vs. peer median of 5.5%) suggests possible understatement of its reported net income.
STZ-US’s accruals over the last twelve months are positive suggesting a buildup of reserves. In addition, the level of accrual is greater than the peer median — which suggests a relatively strong buildup in reserves compared to its peers.
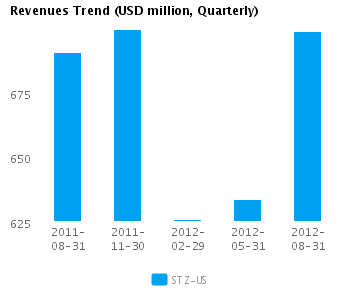
Trend Charts