Earnings Analysis Amphenol Corp. Cl A (NYSE:APH)

Earnings Analysis Amphenol Corp. Cl A (NYSE:APH)Amphenol Corporation (NYSE:APH) recently reported its preliminary financial results based on which we provide a unique peer-based analysis of the company. Our analysis is based on the company’s performance over the last twelve months (unless stated otherwise). For a more detailed analysis of this company (and over 40,000 other global equities) please visit www.capitalcube.com.

Amphenol Corp. Cl A’s analysis versus peers uses the following peer-set: TE Connectivity Ltd. (NYSE:TEL), Molex Incorporated (NASDAQ:MOLX), HIROSE ELECTRIC CO., LTD. (TYO:6806), Belden Inc. (NYSE:BDC), AVX Corporation (NYSE:AVX) and Methode Electronics Inc. (NYSE:MEI). The table below shows the preliminary results along with the recent trend for revenues, net income and returns.
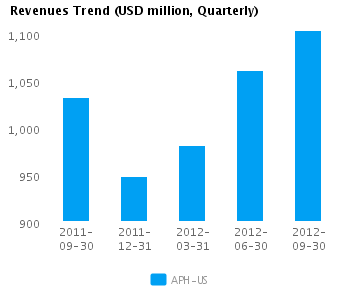
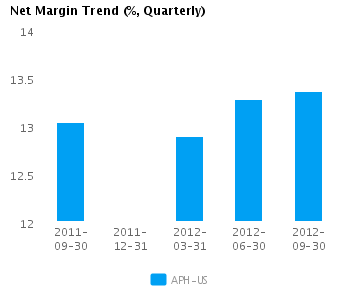
Quarterly (USD million) 2012-09-30 2012-06-30 2012-03-31 2011-12-31 2011-09-30
Revenues 1,103.4 1,061.1 981.6 948.7 1,032.8
Revenue Growth % 4.0 8.1 3.5 (8.1) 1.5
Net Income 147.5 140.9 126.6 113.9 134.6
Net Income Growth % 4.6 11.4 11.2 (15.4) (8.9)
Net Margin % 13.4 13.3 12.9 12.0 13.0
ROE % (Annualized) 25.2 25.0 19.8 20.8 23.9
ROA % (Annualized) 12.0 12.1 11.2 10.3 12.4

Valuation Drivers

Amphenol Corp. Cl A’s current Price/Book of 4.1 is about median in its peer group. APH-US’s operating performance is higher than the median of its chosen peers (ROE of 22.8% compared to the peer median ROE of 11.7%) but the market does not seem to expect higher growth relative to peers (PE of 19.7 compared to peer median of 18.3) but simply to maintain its relatively high rates of return.

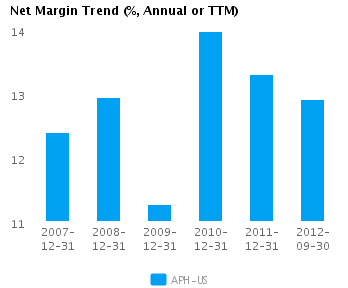
The company attempts to achieve high profit margins (currently 12.9% vs. peer median of 7.9%) through differentiated products. It currently operates with peer median asset turns of 0.9x. APH-US’s net margin continues to trend downward and is now similar to its five-year average net margin of 12.8%.

Economic Moat

The company’s year-on-year change in revenue of 10.9% is better than the peer median but it has not resulted in the same quality of annual earnings growth (5.6% compared to the peer median of 5.6%). This suggests that APH-US’s current relative cost structure needs to improve to move to a leading position among its peers. APH-US is currently converting every 1% of change in revenue into 0.5% change in annual reported earnings.

APH-US’s return on assets is above its peer median both in the current period (11.2% vs. peer median 6.0%) and also over the past five years (13.1% vs. peer median 3.1%). This performance suggests that the company’s relatively high operating returns are sustainable.

The company’s gross margin of 34.3% is around peer median suggesting that APH-US’s operations do not benefit from any differentiating pricing advantage. However, APH-US’s pre-tax margin is more than the peer median (17.7% compared to 10.7%) suggesting relatively tight control on operating costs.

Growth & Investment Strategy

While APH-US’s revenues have grown faster than the peer median (6.8% vs. 3.0% respectively for the past three years), the market gives the stock an about peer median PE ratio of 19.7. This suggests that the market has some questions about the company’s long-term strategy.

APH-US’s annualized rate of change in capital of 18.4% over the past three years is higher than its peer median of 5.2%. This investment has generated an above peer median return on capital of 15.7% averaged over the same three years. Evidently, the relatively high capital investment was successful given the relatively strong growth in its returns.

Earnings Quality

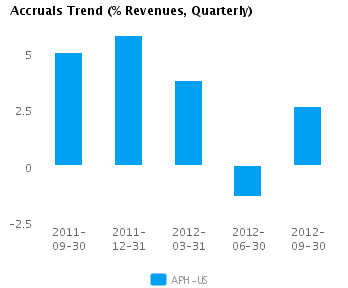
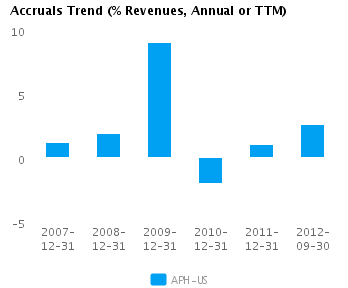
APH-US has reported relatively strong net income margin for the last twelve months (12.9% vs. peer median of 7.9%). This strong margin performance was accompanied by a level of accruals that was around peer median (2.6% vs. peer median of 3.1%) suggesting that the reported net income is supported by a reasonable level of accruals.

APH-US’s accruals over the last twelve months are positive suggesting a buildup of reserves. However, this level of accruals is also around the peer median and suggests the company is recording a proper level of reserves compared to its peers.
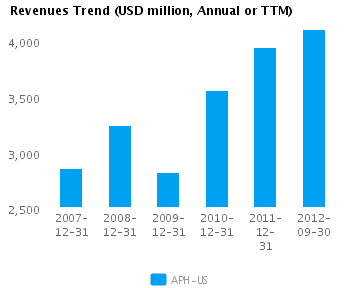
Trend Charts

Graph of Revenues Trend for Amphenol Corp. (NYSE:APH)
Graph of Net Margin Trend for Amphenol Corp. (NYSE:APH)
Graph of Accruals Trend (% revenues, Quarterly) for Amphenol Corp. (NYSE:APH)
Graph of Accruals Trend (% revenues, Annual or TTM) for Amphenol Corp. (NYSE:APH)

Company Profile

Amphenol Corp. designs, manufactures and markets of electrical, electronic and fiber optic connectors, interconnect systems and coaxial and high-speed specialty cable. The Company develops a broad range of connector and interconnect products for information technology and communications equipment applications including the converging voice, video and data communications markets. It also offers a broad range of interconnect products for factory automation and motion control systems, machine tools, instrumentation and medical systems, mass transportation applications and automotive safety systems and a diverse range of on-board electronics. The company also supplies high performance, military-specification, circular environmental connectors that require superior reliability and performance under conditions of stress and in hostile environments. The company operates through two business segments: Interconnect Products and Assemblies and Cable Products. The Interconnect Products and Assemblies segment produces connectors and connector assemblies primarily for the communications, aerospace, industrial and automotive markets. Its products include connectors, which when attached to an electronic or fiber optic cable, a printed circuit board or other device, facilitate electronic or fiber optic transmission. The Cable Products segment produces coaxial and flat ribbon cable and related products primarily for the communication markets, including cable television. Amphenol was founded by Schmitt J. Arthur in 1932 and is headquartered in Wallingford, CT.

Disclaimer

The information presented in this report has been obtained from sources deemed to be reliable, but AnalytixInsight does not make any representation about the accuracy, completeness, or timeliness of this information. This report was produced by AnalytixInsight for informational purposes only and nothing contained herein should be construed as an offer to buy or sell or as a solicitation of an offer to buy or sell any security or derivative instrument. This report is current only as of the date that it was published and the opinions, estimates, ratings and other information may change without notice or publication. Past performance is no guarantee of future results. Prior to making an investment or other financial decision, please consult with your financial, legal and tax advisors. AnalytixInsight shall not be liable for any party’s use of this report. AnalytixInsight is not a broker-dealer and does not buy, sell, maintain a position, or make a market in any security referred to herein. One of the principal tenets for us at AnalytixInsight is that the best person to handle your finances is you. By your use of our services or by reading any our reports, you’re agreeing that you bear responsibility for your own investment research and investment decisions. You also agree that AnalytixInsight, its directors, its employees, and its agents will not be liable for any investment decision made or action taken by you and others based on news, information, opinion, or any other material generated by us and/or published through our services. For a complete copy of our disclaimer, please visit our website www.analytixinsight.com.
This article was originally written by abha.dawesar, and posted on CapitalCube.