ADTRAN, Inc. (NASDAQ:ADTN) recently reported its preliminary financial results based on which we provide a unique peer-based analysis of the company. Our analysis is based on the company’s performance over the last twelve months (unless stated otherwise). For a more detailed analysis of this company (and over 40,000 other global equities) please visitwww.capitalcube.com.
Adtran Inc.’s analysis versus peers uses the following peer-set: Cisco Systems, Inc. (NASDAQ:CSCO), Ericsson (NASDAQ:ERIC), Juniper Networks, Inc. (NYSE:JNPR), Alcatel Lucent SA (NYSE:ALU), Ciena Corporation (NASDAQ:CIEN), Tellabs, Inc. (NASDAQ:TLAB), Sycamore Networks, Inc. (NASDAQ:SCMR), Extreme Networks, Inc (NASDAQ:EXTR) and Calix, Inc. (NYSE:CALX). The table below shows the preliminary results along with the recent trend for revenues, net income and returns.

Valuation Drivers
Adtran Inc. currently trades at a higher Price/Book ratio (1.4) than its peer median (1.2). ADTN-US’s operating performance is higher than the median of its chosen peers (ROE of 10.9% compared to the peer median ROE of 4.2%) but the market does not seem to expect higher growth relative to peers (PE of 13.6 compared to peer median of 13.1) but simply to maintain its relatively high rates of return.
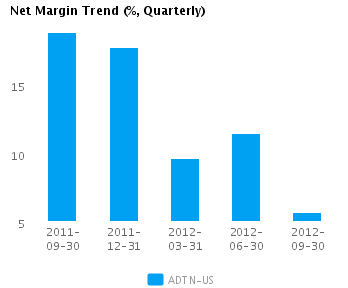
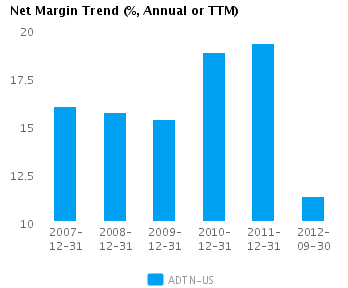
The company attempts to achieve high profit margins (currently 11.3% vs. peer median of 3.0%) through differentiated products. It currently operates with peer median asset turns of 0.8x. ADTN-US’s net margin is its lowest relative to the last five years and compares to a high of 19.3% in 2011.
Economic Moat
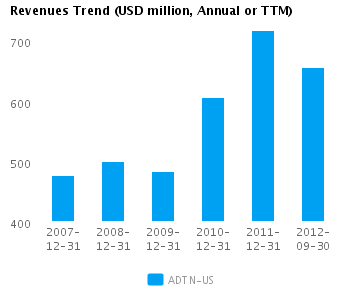
The company’s year-on-year change in revenue of 18.5% is better than the peer median but it has not resulted in the same quality of annual earnings growth (21.6% compared to the peer median of 21.9%). This suggests that ADTN-US’s current relative cost structure needs to improve to move to a leading position among its peers. ADTN-US is currently converting every 1% of change in revenue into 1.2% change in annual reported earnings.
ADTN-US’s return on assets is above its peer median both in the current period (8.7% vs. peer median 1.6%) and also over the past five years (16.4% vs. peer median 2.0%). This performance suggests that the company’srelatively high operating returns are sustainable.
The company’s gross margin of 55.0% is around peer median suggesting that ADTN-US’s operations do not benefit from any differentiating pricing advantage. However, ADTN-US’s pre-tax margin is more than the peer median (17.0% compared to 1.1%) suggesting relatively tight control on operating costs.
Growth & Investment Strategy
While ADTN-US’s revenues have grown faster than the peer median (12.7% vs. 5.6% respectively for the past three years), the market gives the stock an about peer median PE ratio of 13.6. This suggests that the market has some questions about the company’s long-term strategy.
ADTN-US’s annualized rate of change in capital of 20.3% over the past three years is higher than its peer median of 6.9%. This investment has generated an above peer median return on capital of 18.9% averaged over the same three years. Evidently, the relatively high capital investment was successful given the relatively strong growth in its returns.
Earnings Quality
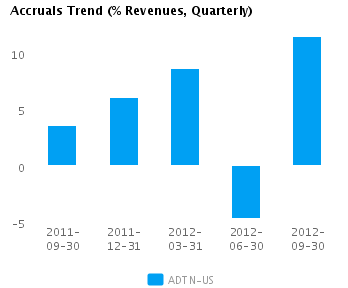
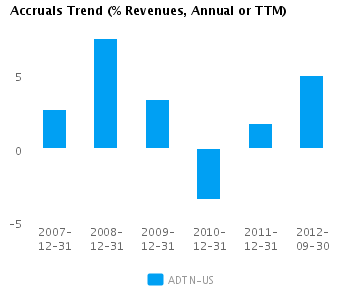
ADTN-US has reported relatively strong net income margin for the last twelve months (11.3% vs. peer median of 3.0%). This margin performance combined with relatively low accruals (4.9% vs. peer median of 9.4%) suggestspossible aggressive accounting and an overstatement of its reported net income.
ADTN-US’s accruals over the last twelve months are positive suggesting a buildup of reserves. But this level of accruals is less than the peer median — which suggests that while the company is building reserves, it is doing so in a relatively modest manner compared to its peers.
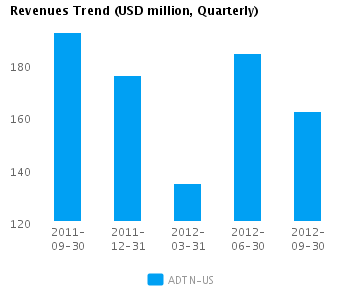
Trend Charts