Are Bristol Myers Squibb Co. (NYSE:BMY) and Eli Lilly & Co. (NYSE:LLY) the pharmaceutical equivalent of the Olsen twins? The two companies have nearly identical market caps of a little over $60 billion. Both pay similar dividend yields — 3.8% for Bristol and 3.7% for Lilly. Several of the companies’ drugs compete in the same markets.
The similarities only go so far, though. And even though those dividends appear to be basically the same, could one actually be the better choice for investors? Let’s find out.

Bristol-Myers Squibb has outperformed Lilly in terms of dividend yield for much of the past decade. However, Lilly took the lead more often than not over the last three years.

BMY Dividend Yield data by YCharts.
Looking at the yield history only presents one view. Dividend investors particularly like companies that consistently sustain and increase dividend payments. How do Bristol and Lilly compare in this respect?

BMY Dividend data by YCharts.
Over the past 10 years, both companies showed consistency in paying dividends. Through 2009, Lilly rapidly grew its dividends. However, the tables have been turned since then. Bristol has been slowly increasing dividends, while Lilly has been in a holding pattern.
The rest of the story
So far, we know that Lilly is paying higher yields as of late, but Bristol-Myers Squibb is increasing its dividends more. These are good to know, but what they don’t tell us is the likelihood of either company encountering problems ahead in paying those dividends.
One important factor to evaluate is the dividend payout ratio, which represents the dividend divided by net income. The higher the ratio, the more concerned we should be about a given company’s ability to continue paying dividends at current levels. Some investors like to see this ratio below 50%, although the industry norms should be considered. I looked at ten large pharmas, including Bristol and Lilly, to calculate an average payout ratio of 63%.
Lilly looks to be in good shape with a dividend payout ratio of 54%, well below the average for the pharmas included. However, Bristol’s ratio currently stands at 117% — more than twice the average. It also was by far the highest payout ratio of the group. That’s concerning. The problem stems from Bristol’s increasing dividends at the same that it’s earnings were plummeting.
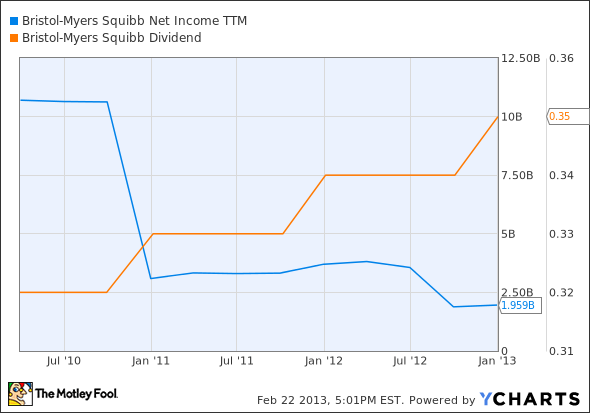
BMY Net Income TTM data by YCharts.
Meanwhile, Lilly’s net income was also going down for most of the last three years. Unlike Bristol, though, Lilly’s management team kept dividends steady rather than raising them in the face of lower earnings.

LLY Net Income TTM data by YCharts.


