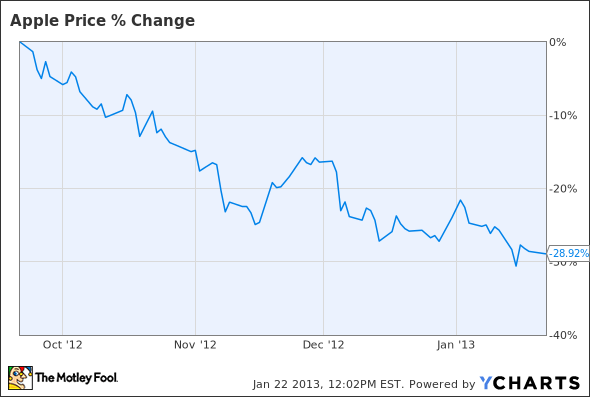
Tomorrow is the day. Apple Inc. (NASDAQ:AAPL) reports its fiscal first quarter results on how it did over the busy holiday shopping season. This particular release is seen as one of the Mac maker’s most important reports in years, in part because of souring investor confidence and the gut-wrenching 30% pullback that shares have experienced ever since peaking in September.
Data by YCharts.
What can investors expect tomorrow? Will Apple Inc. (NASDAQ:AAPL) disprove the bears and report a blowout? Or will the competitive fears begin to weigh? Will Apple continue its bad habit of “missing” Street forecasts?
Indies vs. Pros
Due to the sheer number of professional analysts covering Apple that are constantly tweaking their estimates based on the latest rumblings, consensus estimates are a moving target. The most recent data compiled by Apple 2.0 last week put the average revenue forecast at $54.7 billion with earnings per share of $13.45. Compare those figures to Apple’s own lowball guidance of $52 billion in revenue and earnings per share of $11.75.
Independent analysts used to be more accurate than Street analysts, but the Street has been catching up more recently and the independent analysts now tend to overshoot by a healthy margin. For example, last quarter some of them were predicting sales of nearly $43 billion, which was about 19% too high. Nowadays the Street is wising up to Apple’s ways after consistently getting punked by the iPhone maker.
Time of the season
One minor note is that this year’s fourth quarter has the standard 13 weeks, while the same quarter a year ago had an extra 14th week. That will make the year-over-year comparison seem a little muted, but has already been factored into Apple’s guidance.
That being said, the Street figures above would represent growth of 18% up top and negative 3% down below. It’s important to note that some of the recent margin concerns are all short-term in nature, with the expected contraction relating to the large number of products that Apple just redesigned. Those are the same products that are expected to drive 80% of sales this quarter, and as costs inevitably come down, gross margins should bottom out and work their way back up.
Best of both worlds
Apple’s cost structure is not deteriorating by any means, and it still has incredible structural advantages over its rivals in part due to its integrated strategy.
Generally speaking, most hardware-centric companies have high levels of variable costs related to producing devices, which means their businesses aren’t very scalable. Most OEMs also only manufacture relatively commoditized hardware, keeping their margins low.
On the other hand, software-centric companies face primarily fixed cost structures and inherently are scalable, since additional software sales are incremental to the top line and development costs don’t rise accordingly. That operating leverage is how Microsoft Corporation (NASDAQ:MSFT) is able to boast a gross margin of 74%.
Software companies must expense research and development costs until the product reaches “technological feasibility,” after which point they capitalize and amortize those expenses as part of cost of revenue. Microsoft is rather conservative with when it estimates “technological feasibility,” and Apple Inc. (NASDAQ:AAPL) estimates this occurs almost immediately before products are sold.


