Sprint Nextel Corp. (S): Fundamental Analysis

This week CapitalCube analyzes Sprint Nextel Corporation (NYSE:S). Much smaller than other major telecommunications carriers like AT&T Inc. (NYSE:T) and Verizon Communications Inc. (NYSE:VZ), Sprint Nextel Corporation (NYSE:S) is now providing access to its network to low-cost wireless provider FreedomPop. With a 2GB plan at under $20 a month, FreedomPop offers access to both Clearwire Corporation (NASDAQ:CLWR) and Sprint Nextel Corporation (NYSE:S) networks via wi-fi and could pose a challenge to big carriers like AT&T Inc.

Our fundamental analysis of Sprint Nextel Corporation (NYSE:S) is peer-based. We compare S to its global peers: AT&T Inc. (NYSE:T), Verizon Communications Inc. (NYSE:VZ), Deutsche Telekom AG (PINK:DTEGY), MetroPCS Communications Inc (NYSE:PCS), United States Cellular Corporation (NYSE:USM), and Clearwire Corporation (NASDAQ:CLWR). We also score Sprint Nextel Corporation (NYSE:S) relative to this peer set. For more on CapitalCube’s scoring system click here.

Sprint_S_Stock_Score_CapitalCube

Relative Valuation

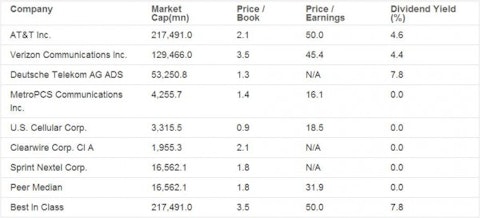
Sprint Nextel Corp.’s current Price/Book of 1.8 is about median in its peer group.

Valuation Drivers

S-US’s EBITDA-based price multiple implies around peer median future growth. The market seems to expect the company to maintain the peer median EBITDA-based return it currently generates.

Operations Diagnostic

Volume Driven
S-US has relatively low net profit margins while its asset efficiency is relatively high.

Earnings Leverage

Compared with its chosen peers, changes in the company’s annual earnings are better than the changes in its revenue, implying better than median cost control and/or some economies of scale.

Sustainability of Returns

Questionable
S-US’s return on assets currently and over the past five years has trailed the peer median and suggests the company might be operationally challenged relative to its peers.

Drivers of Margin

Commodity; High Cost
The company’s relatively low gross and pre-tax margins suggest a non-differentiated product portfolio and not much control on operating costs relative to peers.

Growth Expectations

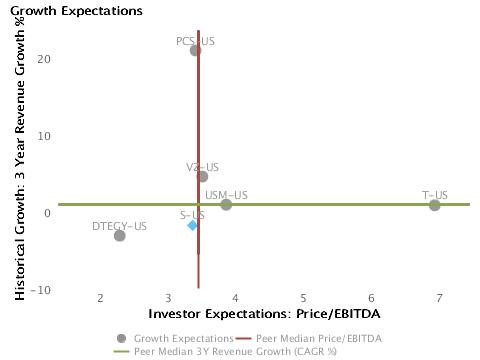
While S-US’s revenues growth has been below the peer median in the last few years, the market still gives the stock a Price/EBITDA ratio that is around peer median and seems to see the company as a long-term strategic bet.

Capital Investment Strategy

Maintenance Mode
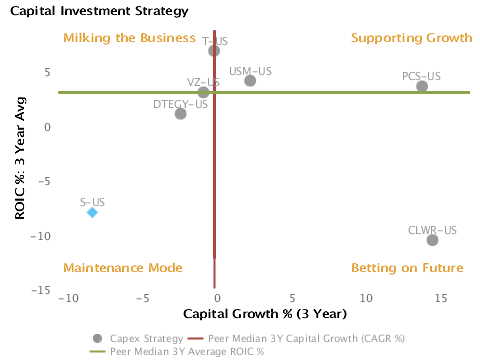
The company’s relatively low level of capital investment and below peer median returns on capital suggest that the company is in maintenance mode.

Leverage & Liquidity

Constrained
S-US seems too levered to raise additional debt.

Share Price Performance

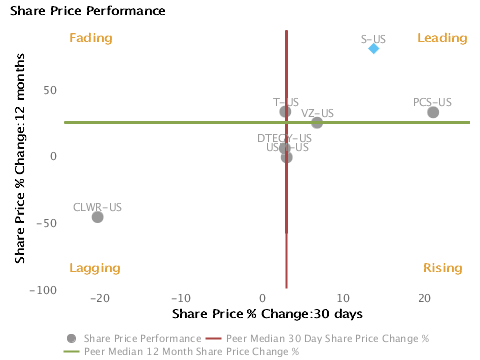
Relative outperformance over the last year and the last month suggest a leading position.

S-US’s share price performance of 79.2% over the last 12 months is above peer median of 23.7%. The 30-day trend in its share price performance of 13.8% is also above the peer median of 3.1% suggesting that this company is a leading performer relative to its peers.
Stock price performance over the last month vs. last year charted with respect to peers for Sprint Nextel Corp. (NYSE:S)

Drivers of Valuation: Operations or Expectations?

Valuation (P/B) = Operating Advantage (ROE) * Growth Expectations (P/E)

Price/Book or P/B valuation is a function of the observed operating performance of the company as measured by ROE multiplied by the market’s current implied growth expectation as measured by the P/E. We define Valuation Premium as the difference between the Market Capitalization and Book Value of Equity, and as a proxy for the NPV of cash-flow associated to the Book Equity investment.
Based on the analysis of the relative contribution to the P/B valuation of “Operations ROE” vs. “Expectations P/E”, we quickly garner insight into peers comparative performance and the market’s assessment of their strategies – are they just “Harvesting” the current business pipeline or are investors betting on a strategic “Turnaround”?

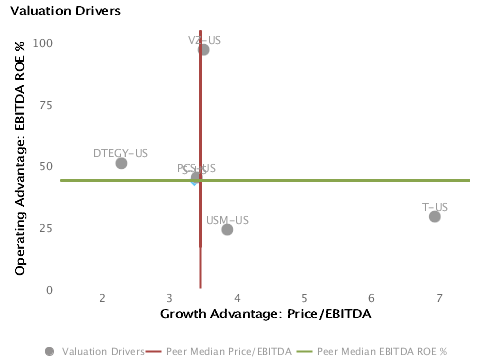
The market expects S-US to maintain the median rates of return it generates currently.

S-US’s PE multiple is negative now so EBITDA ratios provide better peer comparisons. Growth expectations for S-US’s are around median in its peer group (Price to Ebitda multiple of 3.4 compared to peer median of 3.5). The market seems to expect S-US to maintain the peer median return (EBITDA return on equity of 43.5% compared to the peer median of 43.5%) it currently generates. The company’s current Price/Book of 1.8 is about median in its peer group.
Drivers of Valuation: Operations or Expectations? Operating Advantage or ROE% vs. Growth Advantage or P/E for Sprint Nextel Corp. (NYSE:S)

Operations Diagnostic

S-US has relatively low net profit margins while its asset efficiency is relatively high.

S-US has maintained its Volume Driven profile from the recent year-end. Log-in for detailed report.

Earnings Leverage

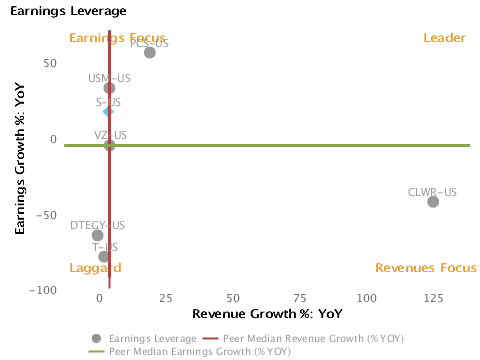
S-US has achieved relatively better changes in earnings than in revenues.

Changes in the company’s revenues are in-line with its peers (annual revenue changed by 3.4%) but its earnings performance has been better — its annual earnings changed by 16.6% compared to the peer median of -5.7%, implying that it has better cost control relative to its peers. S-US currently converts every 1% of change in revenue into 4.8% of change in annual reported earnings.
Earnings Leverage Earnings Growth % vs. Revenue Growth % charted with respect to peers for Sprint Nextel Corp. (NYSE:S)

Sustainability of Returns

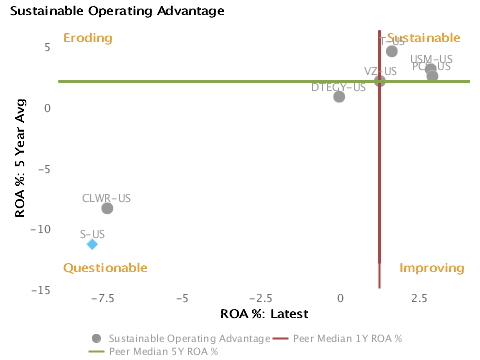
S-US’s relative returns suggest that the company has operating challenges.

S-US’s return on assets is less than its peer median currently (-7.8% vs. peer median 1.3%). It has also had less than peer median returns on assets over the past five years (-11.4% vs. peer median 2.0%). This performance suggests that the company has persistent operating challenges relative to peers.
Sustainability of Returns or 5 year average ROA% vs. Latest ROA% charted with respect to peers for Sprint Nextel Corp. (NYSE:S)

Drivers of Margin

Relatively low margins suggest a non-differentiated product portfolio and not much control on operating costs. S-US has maintained its Commodity/High Cost profile from the recent year-end.

Log-in for detailed report.

Growth Expectations

The market seems to see the company as a long-term strategic bet.

While S-US’s revenues growth has been below the peer median in the last few years (-1.9% vs. 0.8% respectively for the past three years), the market still gives the stock an about peer median Price/EBITDA ratio of 3.4 (Note: We use Price/EBITDA instead of PE due to negative earnings). The market seems to see the company as a long-term strategic bet.
Growth Expectations or 3 Year Revenue Growth % vs. P/E charted with respect to peers for Sprint Nextel Corp. (NYSE:S)

Capital Investment Strategy

S-US seems to be in maintenance mode.

S-US’s annualized rate of change in capital of -8.4% over the past three years is less than its peer median of -0.2%. This below median investment level has also generated a less than peer median return on capital of -8.0% averaged over the same three years. This outcome suggests that the company has invested capital relatively poorly and now may be in maintenance mode.
Capital Investment Strategy or ROIC % vs. Capital Growth % charted with respect to peers for 3 yr average for Sprint Nextel Corp. (NYSE:S)

Leverage & Liquidity

S-US would seem to have a hard time raising additional debt. S-US has maintained its Limited Flexibility profile from the recent year-end.Log-infor detailed report.

Key Valuation Items

Sprint Nextel Corp. (S): Fundamental Analysis

Detailed tables on Revenues & Margins, Key Assets (% of Revenues), Key Working Capital Items, Cash Management Indicators, Key Liquidity Items, Key Cash Flow Items (% of Revenues) are available on logging in.

Company Profile

Sprint Nextel Corp. provides a comprehensive range of wireless and wireline communications services that are designed to meet the needs of individual consumers, businesses, government subscribers and resellers. It provides 4G wireless broadband services. The company builds and operates next generation mobile broadband networks, which provide high-speed mobile Internet and residential access services, as well as residential voice services, in communities throughout the country. It operates through two reportable segments: Wireless and Wireline. The Wireless segment offers wireless services on a postpaid and prepaid payment basis to retail subscribers and also on a wholesale and affiliate basis, which includes the sale of wireless services which utilize the Sprint network but are sold under the wholesaler’s brand. The Wireline segment provides a broad suite of wireline voice and data communications services to other communications companies and targeted business and consumer subscribers. It also provides voice, data and IP communication services to Wireless segment and IP and other services to cable Multiple System Operators that resell local and long distance services and use back office systems and network assets in support of their telephone service provided over cable facilities primarily to residential end-user subscribers. Sprint Nextel was founded by Cleyson Brown in 1899 and is headquartered in Overland Park, KS.

Disclaimer

The information presented in this report has been obtained from sources deemed to be reliable, but AnalytixInsight does not make any representation about the accuracy, completeness, or timeliness of this information. This report was produced by AnalytixInsight for informational purposes only and nothing contained herein should be construed as an offer to buy or sell or as a solicitation of an offer to buy or sell any security or derivative instrument. This report is current only as of the date that it was published and the opinions, estimates, ratings and other information may change without notice or publication. Past performance is no guarantee of future results. Prior to making an investment or other financial decision, please consult with your financial, legal and tax advisors. AnalytixInsight shall not be liable for any party’s use of this report. AnalytixInsight is not a broker-dealer and does not buy, sell, maintain a position, or make a market in any security referred to herein. One of the principal tenets for us at AnalytixInsight is that the best person to handle your finances is you. By your use of our services or by reading any of our reports, you’re agreeing that you bear responsibility for your own investment research and investment decisions. You also agree that AnalytixInsight, its directors, its employees, and its agents will not be liable for any investment decision made or action taken by you and others based on news, information, opinion, or any other material generated by us and/or published through our services. For a complete copy of our disclaimer, please visit our website www.analytixinsight.com.
This article was originally written by abha.dawesar, and posted on CapitalCube.