Marathon Oil Corporation (NYSE:MRO) recently announced the sale of its 10% stake in certain offshore operations in the African nation of Angola for $1.5 billion. The company intends to use the cash for share buybacks. This is just another step towards shareholder value creation. This article discusses the current undervaluation of Marathon Oil Corporation (NYSE:MRO) and the reasons to buy this long-term multi-bagger.

Company overview
Marathon Oil Corporation (NYSE:MRO) is an international energy company that operates in three business segments, exploration and production, oil sands mining and integrated gas. The company was incorporated in 2001 with operations in U.S., Angola, Canada, E.G., Ethiopia, Gabon, Kenya, the Kurdistan Region of Iraq, Libya, Norway, Poland and the U.K. It explores, produces, mines and markets liquid hydrocarbons and natural gas on a worldwide basis. It also extracts and transports bitumen from oil sands deposits in Alberta, Canada, and upgrades the bitumen to produce and markets synthetic crude oil and vacuum gas oil.
Financials
Marathon Oil Corporation (NYSE:MRO)’s revenue has grown at a compounded annual growth rate (CAGR) of 16% in the last four years. The positive trend is also evident in the adjusted EBITDA of the company, which has increased from 53% in 2008 to 57% in 2012. The decrease in net income of the company for fiscal year 2012 was primarily due to an increase in Income tax to 74% from 61% in FY11. This was due to an increase in pre-tax income, which includes the presumption of Libya sales in the first quarter of 2012. Ad valorem taxes are the tax given based on the assessed value of the products sold from each production unit. An increase in U.S assets because of the acquisitions in Eagle Ford Shale has resulted in an increase in these taxes.
| Parameters | 2012 | 2011 | 2010 | 2009 |
|---|---|---|---|---|
| Revenue | 16,221 | 15,282 | 12,873 | 9,084 |
| Growth in revenue | 6% | 19% | 42% | -88% |
| Adjusted EBITDA | 9,242 | 7,741 | 6,320 | 4,837 |
| EBITDA Margin | 57% | 51% | 49% | 53% |
| Net Income | 1,582 | 2,946 | 2,568 | 1,463 |
| Operating Cash Flow | 4,017 | 6,524 | 5,870 | 5,268 |
| Capital Expenditure | 4,940 | 3,295 | 3,536 | 3,349 |
| Free Cash Flow | -923 | 3,229 | 2,334 | 1,919 |
| Total Debt | 6,696 | 4,815 | 7,896 | 8,532 |
| Total debt/EBITDA | 0.72 | 0.62 | 1.25 | 1.76 |
The company has also been able to generate positive operating and free cash flow except for 2012 when the FCF was negative. This decrease was primarily due to an increase in capital expenditures, which will translate into future revenue growth. However, this has been reversed in 1Q13. Balance sheet metrics also look strong with total debt/EBITDA of 0.72 for FY12, which gives the company financial flexibility for future expansion plans.
Key Investment Positives
Marathon Oil Corporation (NYSE:MRO) is focusing on Eagle Ford to drive revenue growth and achieve better margins. Improved well performance is one way through which the company aims to achieve its margin enhancement objective. To achieve this, the company allocated $1.94 billion for planned drilling and $190 million for central batteries and pipeline construction. The investment is expected to increase production significantly from the Eagle Ford.
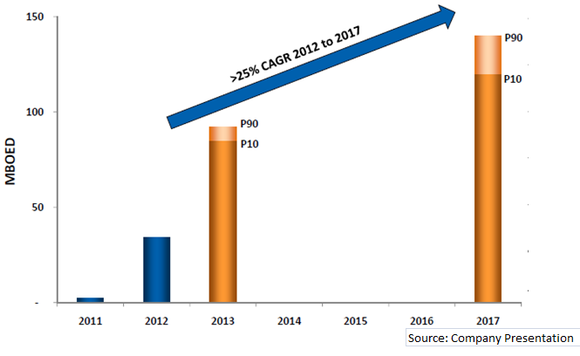
The results of the increased investment and focus on Eagle Ford is already evident from the chart below, which gives the quarterly trend of increase in production from Eagle Ford.
Going forward, the company expects production to grow at a CAGR of 25% (2012-17). If this target is achieved, revenue growth can be expected to be robust over the next few years.
High proven and probable reserves with 10+ years of drilling inventory
Proven and probable reserves are key growth drivers for Marathon Oil. Drilling inventory also play an important role in future earnings of the company. For Marathon Oil Corporation (NYSE:MRO), the proven reserve at the end of FY12 was approximately 2 billion BOE, the highest in 40 years and potential reserves of approximately 2.8 billion BOE. With 10+ years of drilling inventory, the company has significant revenue visibility.


