
Dell Inc.’s analysis versus peers uses the following peer-set: Apple Inc. (NASDAQ:AAPL), Microsoft Corporation (NASDAQ:MSFT), Samsung Electronics Co., Ltd. (KRX:005930), Hewlett-Packard Company (NYSE:HPQ), TOSHIBA CORP (PINK:TOSBF), Lenovo Group Limited (PINK:LNVGY)*, NEC CORP (PINK:NIPNF) and ACER INC S/GDR REG S (PINK:ACEIF). The table below shows the preliminary results along with the recent trend for revenues, net income and returns.
For our Earnings Analysis on Lenovo Group Ltd. ADS (LNVGY) click here.
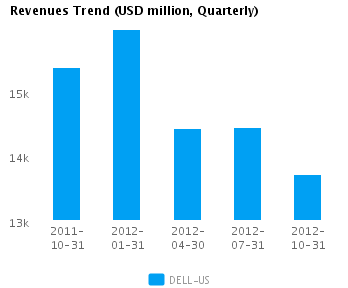
| Quarterly (USD million) | 2012-10-31 | 2012-07-31 | 2012-04-30 | 2012-01-31 | 2011-10-31 |
|---|---|---|---|---|---|
| Revenues | 13,721.0 | 14,447.0 | 14,425.0 | 15,960.0 | 15,380.0 |
| Revenue Growth % | (5.0) | 0.2 | (9.6) | 3.8 | (2.3) |
| Net Income | 475.0 | 732.0 | 635.0 | 764.0 | 893.0 |
| Net Income Growth % | (35.1) | 15.3 | (16.9) | (14.4) | 0.3 |
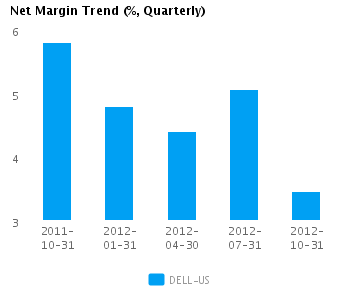
| Net Margin % | 3.5 | 5.1 | 4.4 | 4.8 | 5.8 |
| ROE % (Annualized) | 19.1 | 30.7 | 27.8 | 34.8 | 42.0 |
| ROA % (Annualized) | 4.2 | 6.7 | 5.8 | 7.1 | 8.5 |
Valuation Drivers
Dell Inc.’s current Price/Book of 1.5 is about median in its peer group. We classify DELL-US as Harvesting because of the market’s low expectations of growth (PE of 6.1 compared to peer median of 14.3) despite its relatively high returns (ROE of 27.7% compared to the peer median ROE of 14.2%).
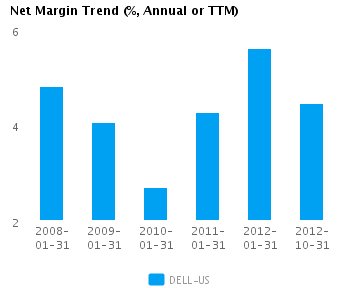
The company attempts to achieve high profit margins (currently 4.5% vs. peer median of 1.6%) through differentiated products. It currently operates with peer median asset turns of 1.3x. DELL-US’s net margin has declined 1.2 percentage points from last year’s high and is now close to its five-year average net margin.
Economic Moat
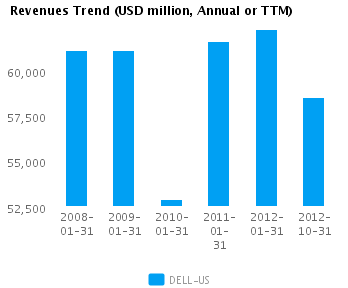
The company’s revenues performance is worse than its peer median (year-on-year change revenue of 1.1%) but its earnings have been relatively good — annual earnings changed by 32.5% compared to the peer median of -19.3%, implying that relative to peers, it is focused on earnings and/or selective about what top-line growth opportunities it pursues. DELL-US currently converts every 1% of change in revenue into 30.4% of change in annual reported earnings.
DELL-US’s current return on assets is better than its peer median (6.0% vs. peer median 3.2%). However, its return on assets over the past five years has only been around the peer median (8.1% vs. peer median 7.3%). This performance suggests that the company may recently have found some new operational advantages to exploit relative to peers.
The company’s gross margin of 22.9% is around peer median suggesting that DELL-US’s operations do not benefit from any differentiating pricing advantage. However, DELL-US’s pre-tax margin is more than the peer median (5.3% compared to 2.6%) suggesting relatively tight control on operating costs.
Growth & Investment Strategy
DELL-US’s revenues have grown more slowly than the peer median over the last few years (0.6% vs. 5.3% respectively for the past three years) and the stock price’s relatively low PE ratio of 6.1 implies relatively low future growth as well. Overall, we view the company’s growth expectations as substandard relative to its peers.
DELL-US’s annualized rate of change in capital of 42.5% over the past three years is higher than its peer median of 6.8%. This investment has generated an above peer median return on capital of 20.7% averaged over the same three years. Evidently, the relatively high capital investment was successful given the the relatively strong growth in its returns.
Earnings Quality
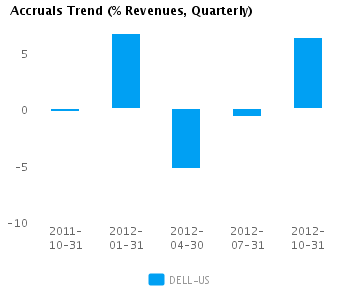
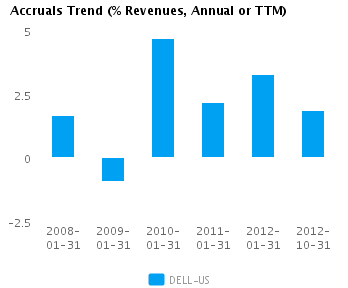
DELL-US has reported relatively strong net income margin for the last twelve months (4.5% vs. peer median of 1.6%). This margin performance combined with relatively low accruals (1.8% vs. peer median of 5.6%) suggests possible aggressive accounting and an overstatement of its reported net income.
DELL-US’s accruals over the last twelve months are around zero. However, this modestly positive level is also less than the peer median which suggests some amount of building of reserves.
Trend Charts
Company Profile
Disclaimer
The information presented in this report has been obtained from sources deemed to be reliable, but AnalytixInsight does not make any representation about the accuracy, completeness, or timeliness of this information. This report was produced by AnalytixInsight for informational purposes only and nothing contained herein should be construed as an offer to buy or sell or as a solicitation of an offer to buy or sell any security or derivative instrument. This report is current only as of the date that it was published and the opinions, estimates, ratings and other information may change without notice or publication. Past performance is no guarantee of future results. Prior to making an investment or other financial decision, please consult with your financial, legal and tax advisors. AnalytixInsight shall not be liable for any party’s use of this report. AnalytixInsight is not a broker-dealer and does not buy, sell, maintain a position, or make a market in any security referred to herein. One of the principal tenets for us at AnalytixInsight is that the best person to handle your finances is you. By your use of our services or by reading any our reports, you’re agreeing that you bear responsibility for your own investment research and investment decisions. You also agree that AnalytixInsight, its directors, its employees, and its agents will not be liable for any investment decision made or action taken by you and others based on news, information, opinion, or any other material generated by us and/or published through our services. For a complete copy of our disclaimer, please visit our website www.analytixinsight.com.
This article was originally written by abha.dawesar, and posted on CapitalCube.


