Two ratios which investors use to gauge the value of a company are the P/E ratio and the PEG ratio. The P/E ratio tells you the price of a stock relative to its current earnings and the PEG ratio tells you the price of a stock relative to its future growth. But a question often arises: should you use past earnings or estimated future earnings to calculate these ratios?
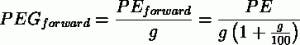
Two different P/E ratios are usually quoted. The first, normally called simply the P/E ratio, is the stock price divided by the most recent annual earnings per share, or possibly the TTM earnings per share. Either way, this ratio values the company based on the past. The second, the forward P/E ratio, is the stock price divided by an estimate of next year’s earnings per share. Since you’re buying the stock based on its future prospects on the surface this forward ratio makes sense. The weakness comes from the fact that this ratio is based on a guess. Often the average analyst estimate for next year’s earnings is used for this calculation, and that estimate is routinely revised as the year goes on. It would make more sense, then, to use a conservative estimate in an attempt to eliminate this problem. But this all leads to another question: what’s the PEG ratio for if we’re already accounting for growth in our P/E ratio?
The PEG ratio
The PEG ratio is simply the P/E ratio divided by the earnings growth rate. If a company is expected to grow earnings by 20% per year, the denominator is 20. A PEG ratio below 1 suggests that the stock may be undervalued while a PEG ratio above 1 suggests that the stock may be overvalued, but the PEG ratio is more of a rule of thumb than anything.
When calculating the PEG ratio a choice arises. Do you use the normal P/E ratio or the forward P/E ratio? Is there a meaningful difference? There is, and here’s why.
Doubling down on a guess
The future growth rate is a guess. While the normal P/E ratio is fixed the forward P/E ratio is based on this guess, a guess which could very well be completely wrong. This introduces uncertainty into the forward P/E ratio calculation. Let’s imagine a fictional company that had an EPS of $1 last year and trades for $20 per share. This puts the normal P/E ratio at 20. Analysts are predicting earnings growth to be anywhere between 15% and 25%, with the average right around 20%. Instead of simply using this average, let’s assume that growth can truly be anywhere within this range and calculate a range of forward P/E ratios. This puts our forward P/E ratio anywhere between 16 and 17.39, with an average of 16.695. The size of the range is 8.3% of the average.
Now we turn to the PEG ratio, which also depends on our estimate of growth. If we use the normal P/E ratio of 20 our range of PEG ratios is 0.8 to 1.33, with an average of 1.066. The size of this range is 49.7% of the average. So our uncertainty regarding the future growth has a significant impact on our range of PEG ratios.
But what happens if we use our forward P/E ratio instead? This would create a PEG range of 0.64 and 1.16, with an average of 0.9. The size of this range is 57.8% of the average. We’ve become even more uncertain about the PEG ratio because we’ve involved our guess twice:
With the normal PEG ratio our guess for growth only shows up once. In our forward PEG ratio, however, it shows up twice, once from the forward P/E ratio and once from the PEG ratio itself. This causes our uncertainty to be compounded.
This is why using a forward P/E ratio when calculating a PEG ratio doesn’t make sense. You’re already including your growth estimate, so why include it a second time and make the uncertainty higher? The PEG ratio is an extremely rough rule of thumb to begin with, so there’s no need to make it even rougher.
Be careful with screens
This is why screening for stocks by PEG ratio isn’t all that useful. You often don’t know which P/E ratio the screen is using or what growth assumptions it’s using. Even if you did, as we saw above, the uncertainty in the growth assumption makes for even more uncertainty in the PEG ratio.
Using the Finviz stock screener I’ve searched for stocks with PEG ratios below 1 and sorted by market cap. Here are three examples of what I’m talking about.
Apple (NASDAQ:AAPL) – Finviz has Apple’s PEG ratio at 0.53. This would suggest that Apple is extremely undervalued. Looking at Yahoo Finance the range of earnings estimates for the fiscal year ending September 2013 is $40.73 – $51.06. This represents EPS growth between -7.75% and 15.65% and a forward P/E ratio between 8.44 and 10.58 (I’ll ignore the giant cash balance for simplicity). Our forward PEG ratio, then, is anywhere between 0.53 and infinity. Finviz is assuming the highest estimate in its calculation, but the uncertainty here is enormous. The PEG ratio, in this case, is pretty much meaningless.
Intel Corporation (NASDAQ:INTC) – Finviz lists Intel’s PEG ratio at 0.83, also well within the supposed undervalued regime. Yahoo Finance has the range of earnings estimates for fiscal 2013 at $1.58 – $2.17 per share, representing growth from -25.8% to 1.9%. Using 2014 estimates this range is from -20.7% to 17.4%. I won’t even bother going further: it should be clear from the last example that a PEG ratio based on these numbers is completely meaningless. With a current P/E ratio of just about 10, a PEG ratio below 1 would require average annual earnings growth of about 10%. So instead of dealing with analyst estimates, a good question to ask is if Intel Corporation (NASDAQ:INTC) can grow earnings by 10% annually in the long term. Given its market-leading position this seems plausible. This would mean doubling earnings every 7.25 years, conceivable if Intel Corporation (NASDAQ:INTC) succeeds in the mobile market.
Caterpillar (NYSE:CAT) – Finviz lists Caterpillar’s PEG ratio at 0.78. Yahoo finance has the range of earnings estimates for fiscal 2013 a $7.26 – $8.54, both below 2012’s results. The range for 2014 is $8.50 – $10.63, or growth between -4.5% and 19.4%. Again, there’s so much uncertainty here that basing a calculation off of these numbers is pointless. With a current P/E ratio of about 11 the company would need long-term 11% earnings growth for a PEG ratio below 1. Finviz’s number would suggest 14% annual growth, which is the average 5-year estimate from analysts. But as we’ve seen, the range on this estimate is probably enormous, making the uncertainty in the PEG ratio even more enormous. Just because it’s an average doesn’t make it more correct. Averaging a bunch of terrible guesses does not necessarily lead to a better one.
The bottom line
Whenever you calculate something like a PEG ratio, remember that analyst estimates for growth are rarely correct. The range from different estimates is typically large, leading to an even bigger range in possible PEG ratios. What’s more, using the forward P/E ratio in your calculation compounds the uncertainty and makes the result even worse. The PEG ratio is a rough rule of thumb, and it is very much a garbage-in garbage-out type of calculation. It’s best to use a very conservative long-term estimate for growth and the current P/E ratio in calculating the PEG ratio. This reduces the risk of an unpleasant surprise and minimizes the effect of uncertainty in your growth estimate.
The article Be Careful With Forward P/E And PEG Ratios originally appeared on Fool.com and is written by By Timothy Green.
Copyright © 1995 – 2013 The Motley Fool, LLC. All rights reserved. The Motley Fool has a disclosure policy.


