
The title of a recent CBS MoneyWatch article sums up the sentiment perfectly: “Stock Market Bubble: Red flag warning.” According to the author, there’s reason to believe that stocks are becoming “frothy” because margin debt — that is, the debt that investors use to purchase stocks in the brokerage accounts — is headed for another peak akin to the dot-com and housing bubbles. Here’s a chart to demonstrate the point:

But there’s another side to this story. Enter Josh Brown, author of The Reformed Broker — a blog I encourage readers to check out. In a post published at the end of last week comparing the stock market in 1999 to today, Josh makes a convincing argument that all of this concern is much ado about nothing.
Here’s a very rudimentary but essential thing to be aware of — in 1999 the S&P 500 finished at 1469, earned 53 bucks per share, and paid out $16 in dividends. These are nominal figures, not adjusted for inflation.
The 2013 S&P 500 is earning double that amount — over $100 per share. The index will also be paying out double the dividend this year, more than $30 per share, and returning even more cash with record-setting share repurchases.
This sounds pretty good; what’s the catch?
What kind of premium, pray tell, are we paying for double the earnings and twice the dividend yield versus 1999’s market? I’m so glad you asked — turns out we’re not paying any premium at all. We’re paying a discount. 50% off. The current S&P 500 trades for a P/E of 14 versus 33 for 1999. So double the fundamentals for half the price.
Sound frothy to you?
Josh then goes on to discuss the Case-Shiller cyclically adjusted P/E ratio, or CAPE. For those of you who aren’t familiar with this metric, it’s a 10-year rolling average of the S&P 500’s P/E ratio. Its advantages are twofold. In the first case, it’s the most widely available historical valuation metric you can find for the broader market — do a search for the S&P 500’s historical P/E ratio, and it’s basically the only game in town. And in the second case, as its name suggests, by controlling for cyclical variations in valuation multiples, it makes for a nice, smooth line to include in charts.
But, as Josh points out, there’s a problem with relying on this metric to make contemporaneous investment decisions. That is, by including the last 10 years of valuations, the CAPE overstates the S&P 500’s current multiple by nearly 38%. You can see this in the following chart, which compares the index’s actual P/E ratio to the CAPE.
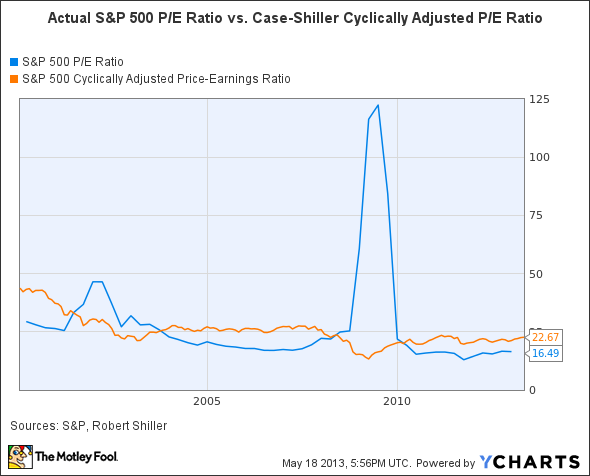
S&P 500 P/E Ratio data by YCharts
Suffice it to say, the current gap is a function of the financial crisis, shortly after which corporate earnings were eviscerated and thus valuation multiples shot through the roof. This trend was particularly robust in the financial space, where large banks such as Bank of America Corp (NYSE:BAC) and Citigroup Inc (NYSE:C) were forced to record massive losses because of overexposure to subprime mortgages.


